Scanning Tunneling Spectroscopy of Insulating Films
Paper for Advanced Solid State Physics class, Dmitri Y. Petrovykh.
Physics Department, University of Wisconsin, Madison, WI, USA (1999)
-
1 STM and STS of Bulk Insulators
2 STS of Thin Film Insulators -
1 Tunneling Current Theory
2 Tunneling Barrier Parameters
3 The Simplest Model for T(E,V)
4 Thermal Broadening Included
5 More Accurate Tunneling Probabilities - Possible Additional Effects
- Acknowledgments & References
II.5 More Accurate Expressions for Tunneling Probabilities
In the previous section, WKB-like approximation was used for the tunneling probabilities through vacuum and insulator barriers. Let us examine this assumption. For tunneling, the criterion for applicability of WKB approximation10 can be written as:

where d is the barrier thickness, H—its height; E—energy of the particle, and m—its mass.
Schematic representation of the energies involved in the tunneling junction considered in our problem is presented in Fig. 8. For the vacuum barrier, we have the average height H = φ + ½V and particle has energy E.
Note that in Fig. 8 E=0 is taken at EF of the sample, rather than the tip, so some formulas appear differently from the ones used in Sections II.2–4.
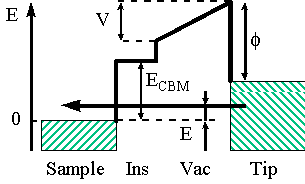
Fig. 8 Energy diagram for the tip-sample tunneling through vacuum and insulator layers, with applied bias.
For typical values of (H-E) > φ − ½V ~ 2 eV and d ~ 11 Å, the WKB criterion becomes: 11*(0.51*2)½ = 11.1 >> 1.
As we can see, for the vacuum barrier the use of WKB-type formula may be justified. One can also note that similar approximations have been successfully used for modeling of "cold emission". Therefore, at the desired level of accuracy, we can leave this simplification intact.
From Fig. 8 it is clear, however, that for bias values V ~ ECBM the WKB criterion is certainly not satisfied. As a matter of fact, the energy of the particle can be below, equal or above the barrier height (ECBM in this case). Therefore, even with the square barrier assumption, the complete formula for the tunneling probability should be used. Fortunately, for this case it has been derived in most textbooks on quantum mechanics (e.g., in Ref 10).
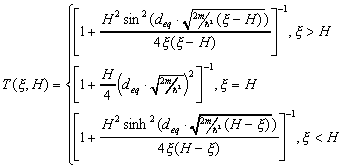
Where ξ is energy of the electron; H is barrier height; m is electron mass; deq is "equivalent" barrier width given by deq = dins(meff)½ combination of the insulator thickness dins and effective mass meff.
For comparison of the tunneling probabilities resulting from the WKB-type formula used in Sections II.3–4 and the above expression see Fig. 9. The barrier height was set to 10 in both calculations. Note, that the former formula (solid line in Fig. 9) gives a sharp change at the energy equal to the barrier height, whereas the latter expression (dashed line in Fig. 9) exhibits a smoother rise, and never flattens out at the higher energies. Since the dI/dV extrema basically correspond to the extrema of the tunneling probability, the position of the first peak will not be exactly at the barrier height, and there will be more peaks at higher energies, albeit not quite as well pronounced. We can expect the position of the peak then to be related to the barrier height (ECBM) and the width of the peak to depend on deq.
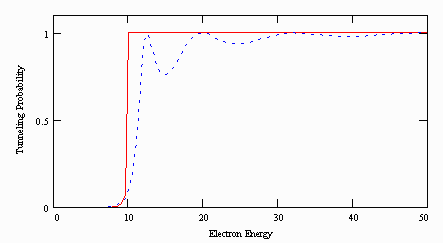
Fig. 9 Comparison of the tunneling probabilities in case of WKB-type approximation (solid line) and exact formula for tunneling through a square barrier (dashed line). Barrier height is 10 in both cases.
The parameters of the resonance peak do depend significantly on both ECBM and deq, as shown in Fig. 10. The peaks themselves became broader and more asymmetric compared to those in Fig. 5. Only for values of deq > 5 Å, the peaks are actually easy to discern (in the simpler model, peaks, albeit small ones, are visible for all values of dins). In addition, we do indeed observe extra oscillations at higher energy ends of the curves.
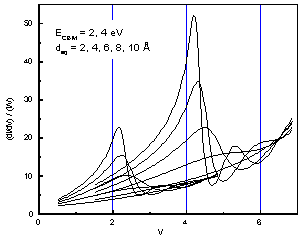
Fig. 10 Resonance peak dependence on ECBM and deq. Note that the peaks are significantly shifted from respective ECBM's.
Dependence of the peaks' parameters on the model's variables can be summarized as follows (Fig. 11). Peak position is almost invariably different from ECBM, and for each value of ECBM the patterns of deviations are very similar (Fig. 11 left). For a fixed value of ECBM peak height depends on deq as α * deqβ where α and β are constants (Fig. 11 center). α depends strongly on ECBM, and β = 2.3 in all cases. The width of the resonance depends strongly on deq, but only slightly on ECBM (Fig. 11 right). Actually, it is hard to define a width for such asymmetric peaks (width at half maximum was used in Fig. 11 right), so ECBM dependence may not be real.
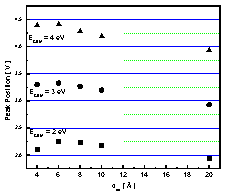
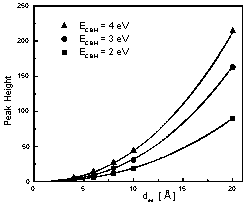
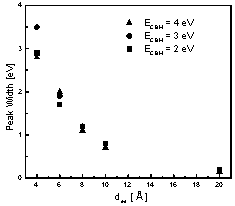
Fig. 11 Resonance peak parameters dependence on ECBM and deq: position (left), height (center), width (right). All three exhibit strong dependence on deq , but only the position and the height depend strongly on ECBM.
And finally, an attempt was made to reproduce the experimental data (Fig. 2) with this improved model. The resulting curves are presented in Fig. 12, they are still qualitatively similar to the ones from Fig. 2.
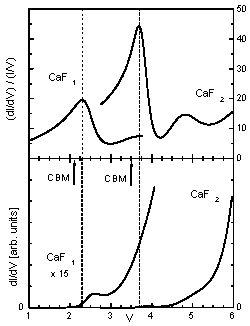
Fig. 12 Calculated tunneling spectra obtained from a minimal model for tunneling through an insulator film. Spectra are shown for CaF2 and CaF1, analogous to the data in Fig. 2.
The values of ECBM were taken as 2.1 eV for CaF1 and 3.5 eV for CaF2 (arrows in Fig. 12), with the above mentioned shifts accounting for the correct peak positions (at 2.3 and 3.7 eV respectively - dashed lines in Fig. 12). Vacuum barrier widths (dtip) were taken the same as in the previous model (10 and 11 Å respectively). "Equivalent" thickness deq was chosen to produce peak heights close to the observed ones, the values were 9 and 10 Å respectively. If we recall that deq = dins(meff)½ and the values of the actual insulator thickness dins used before (2.7 and 3.93 Å), we would need meff ~ 10.
